Building memorable and consistent customer experiences is tough. RetailX research reveals that retailers often perform strongly here, yet there’s plenty of room for improvement too. Jonathan Wright looks at the numbers.
Where does the customer experience begin and end?
In the era of multichannel retail, it is probably best to assume that any area where a consumer interacts with the business, however briefly, is potentially crucial to that business. A thoughtless or glib response to a question via social media, a clunky website experience, or even a third-party courier who is rude when making a delivery: all of these are interactions that can fundamentally affect a customer’s perception of a retailer.
Another factor here is that the best of the best within the IREU Top500 not only understand the importance of the customer experience, but increasingly build businesses around their customers. Consistency across touchpoints, we should also emphasise, is key. Shoppers who are used to high standards will simply not shop with retailers that underperform in comparison with competitors.
From this, it follows that RetailX researchers measure a broad range of metrics when considering performance within The Customer Dimension. RetailX’s ongoing research considers the availability, consistency, convenience and cost of basic services such as delivery. Other metrics include the design and performance of mobile and desktop websites, responsiveness and helpfulness across multiple customer service channels, and the integration of feedback and reviews. The convenience of making and receiving a purchase is key to the customer experience, and it’s also important for customers to be able easily to return goods.
Channel comparisons
Looking at responses across channels, research revealed one especially intriguing statistic. The median response time across the IREU Top500 for queries is quicker via Facebook than via email: seven hours for Facebook as against 15 hours for email and web submission forms. A number of factors may play in here. Facebook enquiries may be more straightforward to deal with, while knottier issues require an email (although RetailX researchers used the same type of simple question to test both channels). These figures may align more closely as retailers integrate social media teams, which tend to have a certain amount of autonomy when first set up, more deeply within the overall business.
That’s not to say all sectors are performing equally well when it comes to dealing with Facebook enquiries. IREU Top500 retailers selling jewellery responded to Facebook queries in a median time of 2.6 hours, while for fashion footwear retailers the figure was three hours. Sports and leisure clothing (3.4 hours) also performed strongly. At the other end of the spectrum, Music, film and TV retailers had a median response time of 14.4 hours. Garden supplies retailers (14.3 hours) were also quite slow.
Looking at the IREU Top500 as a whole, the median response time was 7.1 hours, yet brands outperformed the competition slightly here with a median time of 5.8 hours.
Turning to email responses, retailers in the fashion footwear, fashion clothing, and fashion accessories sectors were most likely to resolve an issue with one email. Conversely, retailers selling groceries, drinks and garden supplies were least likely to resolve an issue with one message. In terms of speed of email response, marketplaces had the shortest median email response time (seven hours), followed by ready-made food (11.4 hours) and fashion clothing (12 hours).
Sector analysis
Looking across the IREU Top500, the median number of communication channels that retailers used was four, rising to five for the ready-made food sector and six for direct-selling brands.
In terms of offering the facility for customers to leave feedback, RetailX researchers found that 71% of marketplaces enabled customers to leave product ratings. Retailers in the sports and outdoor equipment (70%) and consumer electronics (66%) sectors are also very likely to support that feature. Conversely, ready-made food showed the lowest adoption (32%) of this feature, followed by fashion clothing (42%) and fashion accessories (41%). Brands performed less strongly than we would have expected here, with just 42% offering this feature against an EEA weighted average of 52%.
Where brands did perform more strongly was on Twitter. RetailX research found that brands on average had 600,000 followers on Twitter, almost three times more than the figure for the overall IREU Top500.
Returns
Not every purchase works out, and it is therefore important for customers to be confident that it will be a quick and easy process to return goods. In this context, it is intriguing to note that returns policies do vary from sector to sector.
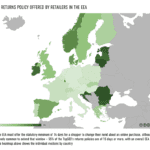
Against a benchmark of 19 days (the median length of unwanted products return policy of the Top500 in the EEA), retailers in the fashion accessories, clothing and footwear, and sports and leisure clothing and footwear sectors (all 23 days) offer significantly more time. Retailers in the children’s toys and accessories, consumer electronics, books, software, health, and music, film and TV sectors, by contrast, offer just 14 days, the EU-required minimum.
A need for speed
One area that’s worth looking at in more detail is the loading speed for websites. This is important because usability studies reveal how consumers will react negatively to even the smallest delays. Despite this, it seems that many Top500 websites, when measured in 2019, were not appreciably faster than in previous years. Indeed, The median time to visual completion for IREU Top500 landing pages on desktop devices was the same (eight seconds) as 18 months ago. A more sophisticated aggregate metric, Speed Index, shows a slow-down in median load times, perhaps reflecting a 5% increase in the median page size.
This matters because, while consumers are increasingly investing in fast broadband connections, retailers are not keeping up here, with those who did achieve improvements often managing improvements that could only be measured in microseconds. While it is outside the scope of our research, the risk here is that consumers will begin to notice that distributed websites such as social media platforms and streaming services are faster to load than sites offered by retailers. Slow load times also close off options such as using augmented reality (AR) technology
or video within merchandising.
In conclusion
To return to the idea of The Customer Dimension encompassing metrics across many facets of RetailCraft, it’s clear that not every retailer is going to perform strongly across the board. Nevertheless, there are clearly areas where retailers can make far more than incremental gains – and need to do so just to keep up with competitors.
Looking ahead, this need for a seamless and consistent customer experience is not going to go away. Just the opposite. Retail will become more complex as customers expect stores, pop-ups, websites, apps and even packaging to convey a retailer’s values. Mixed messages will only result in lost sales.


