When it comes to speed, retailers’ mobile performance is patchy across Europe. Our research shows companies need to pay close attention to improving the load time of mobile sites, suggests Martin Shaw
Customers hate DELAYS in being served. This retail truism has become clearer and clearer in the digital age, in great part thanks to usability research showing how even incremental improvements in page speed times can have a radical impact on a retailer’s overall performance.
“Online shoppers hate waiting and there’s plenty of evidence that slower pages lead to lower conversion rates, higher bounce rates and an overall decrease in visitor engagement,” says Andy Davies, associate director for web performance with InternetRetailing Knowledge Partner NCC Group and an expert on site optimisation.
This is as true in the mobile sphere as it is with desktop. A recent study by DoubleClick found that “53% of mobile site visits are abandoned if pages take longer than 3s to load”. Despite this, many mobile sites don’t achieve this. “The average load time for mobile sites is 19s over 3G connections,” DoubleClick noted when revealing the results of the study. “That’s about as long as it takes to sing the entire ‘Alphabet Song’!”
For busy retailers, it may seem that shoppers are being unreasonable in their expectations, but it’s important to realise we often can’t help ourselves but to click away. “It’s not that shoppers are being impatient,” says Davies, “it’s just that subconsciously people are aware of even sub-second waits, and a delay of just a few seconds increases our stress levels and forces us to concentrate harder.”
In itself, this explains why the idea of a Speed Index (see boxout overleaf), which, in Davies’ words, measures “how long the visible part of the page takes to complete” is so powerful. While it may initially seem an overly abstract notion, the Speed Index we’ve used in our research is actually “a useful proxy for a visitor’s experience”.
Key findings
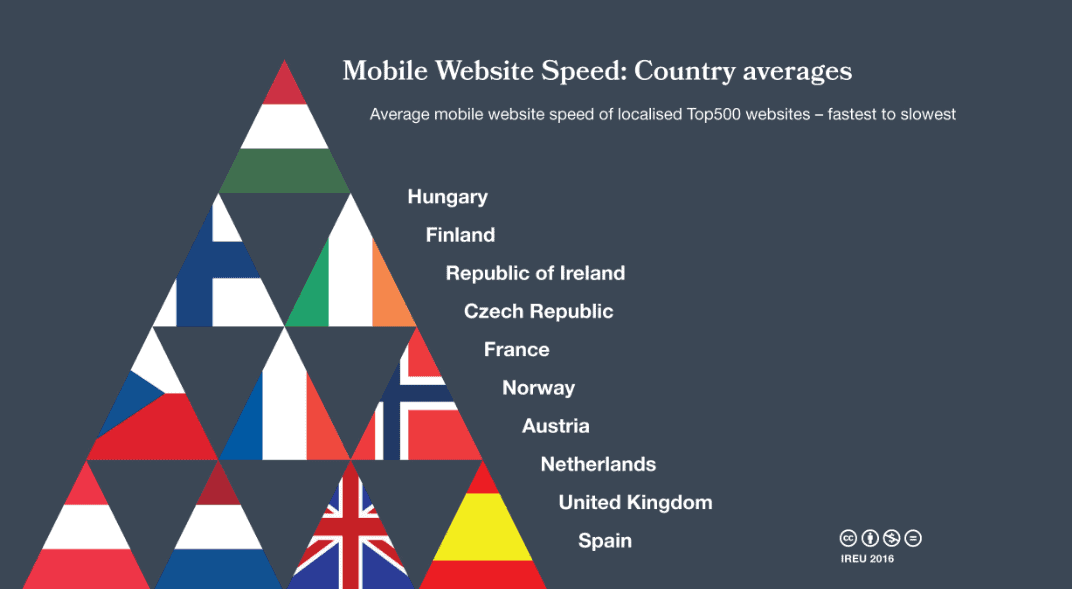
How are European retailers performing here? In this article, while we’ll touch on desktop performance, we focus largely on mobile, where NCC Group assessed mobile performance via emulated browser rendering. Among the key findings, we found that:
• IREU Top500 retailers’ mobile web performance was best by Hungarian and Finnish retailers. In these countries, the Speed Index was 16% lower than the overall average for the Top500.
• The quickest full-page load time was achieved by Belgian and Dutch retailers, 18% quicker than the average IREU Top500 load time.
• The fastest average time to visual completeness is by Ireland, Hungary, and France-localised websites, with an average of 5.3s, 15% quicker than the overall average for the Top500.
But despite the research revealing such granular detail, it’s intriguing that regional variations within the Speed Index are surprisingly difficult to pick up. “There are fast sites and slow sites right across Europe,” says Davies. “Some multi-country sites are consistently fast across all the countries the retailer operates in, and others vary from country to country. This seems to be due to different content approaches between teams in different countries rather than due to technology itself.”
Zooming out, do retailers understand the importance of speed, of consumers not having to wait? Davies says the picture is patchy. “Some retailers understand that being fast is important, but it’s also clear from the results that many retailers don’t treat it as a priority,” he notes. “There are some really fast retail sites across Europe, but there are many that have large pages, made up of many components and so are slower to download.”
Mobile growth
It’s worth reiterating that this is particularly important at this juncture because we’re at a point where shoppers across Europe are becoming more and more comfortable with the idea of shopping on mobile. As in the UK, mobile growth is outstripping even some of the most optimistic predictions.
“For some retailers [mobile represents] more than half their revenue but yet overall mobile conversion rates remain lower than their tablet and desktop counterparts,” says Davies. “One of the biggest problems with many of the sites is they’re trying to scale down a desktop site to fit mobile. Some content is downloaded but never displayed, the images are too large so phones must shrink them, and there’s just too much JavaScript on many pages.
“There needs to be a mind shift amongst retailers, they need to think about how to start with mobile, how to deliver a great mobile experience – and then enhance it for shoppers who have larger screens, reliable internet connections and powerful desktops. Some retailers have demonstrated that a fast mobile experience is possible so the other retailers could achieve that too.”
This begs the question of what do the best-performing retailers do that other retailers don’t? While the research doesn’t reveal specific information about different approaches, Davies has overarching advice.
“Everyone’s experience of the web is different,” he says. “Some people have new iPhones, some older ones, others might have Android phones; people might access the web via wifi, 4G, 3G or even 2G mobile networks and all these factors lead to page load speeds that vary for different visitors.
“To get a real-world understanding of what visitors experience, retailers shouldn’t just test their sites using an iPhone over the office wifi. They need to put themselves in their customers’ shoes and get older iPhones, or mid-range Samsung or Motorola phones, and try using their sites from a coffee shop, walking down the street or even on a train.
“Ideally retailers should use ‘Real User Monitoring’ (RUM), which allows them to measure every visitor’s experience across every page on the site and track the effect on business metrics – there are some startling differences between popular phones. Speed is a feature, it’s all about reducing friction and making the shopping experience as easy as possible. Imagine if a shopper could flick through a website as fast as they could a paper catalogue, how would that change their behaviour?”
Desktop load times
While we’ve focused on mobile here, it’s also worth remembering that many – and, for some retailers, most – purchases now aren’t made via one channel. Rather, customers will, for example, do research via mobile before purchasing via desktop or in-store.
It follows that, even as mobile becomes a more important channel, it’s not enough for retailers to put money and development time into mobile offerings to the exclusion of other channels. Rather, the ideal is for a customer skipping from one channel to another never to have to wait too long in any channel. Consistency here is key.
In terms of desktop performance, we found that retailers in Norway, the Netherlands and Denmark scored best in terms of Speed Index ratings. Looking in more detail, we also found the following:
• Customers in Italy were able to see something on the page, ‘render time’, in less than 3s. This was 7% quicker than the average for the Top500.
• The quickest time for the full page to load was observed for Belgian retailers. The average time for retailers in Belgium was 9% quicker than the average for the Top500.
• The quickest time achieved for the visual completeness was 7.9s, 9% quicker than the average Top500 performance.
To return to where we began, wider usability research suggests that even incremental improvements in the best figures above would be reflected in the bottom line.
Speed Index explained
Speed Index is a measure of how quickly the visible parts of a web page are displayed. Speed Index is worked out by looking at the video frames of a page as it renders. Each frame is given a score for visual incompleteness above the fold. So the score is 100% for a blank screen and 0% for a visually complete page.
The next step is to multiply that score by the number of milliseconds since the last frame (or since the beginning of the test if it’s the first frame). The final step to working out the Speed Index is to add these numbers together. The total is the Speed Index score.
For more on how this works, go to: http://etail.li/speedindex