Leaders in this Dimension met demanding shopper expectations of both service and usability, InternetRetailing researchers found
IT WAS BY GIVING the customer the best online experience that retailers stood out for their performance in The Customer Performance Dimension. Researchers measured customer service and the user experience of desktop and mobile websites and apps.
Analysis included new metrics for 2018 in order to assess an experience that is constantly evolving. New measures include the average time shoppers spend on a website, as calculated with InternetRetailing Knowledge Partners Hitwise and SimilarWeb . The relevance of search results on a desktop and a mobile website, the use of personalisation on the website and a number of mobile website-specific user experience (UX) metrics are also assessed for the first time. Ease of navigation and the use of a ‘hamburger’ button – the three lines that are standard in modern mobile navigation – are also factors in this ranking.
Around half of Top500 retailers have one or more mobile apps and these retailers are also assessed for their apps’ usability and customer experience, although retailers without apps are not marked down. Metrics here include whether live chat – one of the most popular customer service channels – is available on the app, along with different features that retailers can use to personalise their experience. Whether app users can scan in a store loyalty card or sign in with an existing store membership are measured because they enable retailers to complete a single view of the customer across sales channels.
WHAT THE TOP500 DO
Top500 retailers enable shoppers to communicate with them via a median of eight channels. Almost all use Facebook and Twitter (both 98%), followed by phone (96%) and email (93%). Least used of the 13 channels assessed are Tumblr (17%), Snapchat (22%) and live chat (37%). Retailers responded to an email enquiry in a median 16h 13m and to a Facebook query in a median 34m. It was three days before the channels showed an equivalent proportion of responses, when three quarters of the Top100 had responded on each channel (see inset chart). Research conducted in collaboration with Knowledge Partner NCC Group found that the median desktop home page is 2.6MB (up from 2.3MB in 2017), starts to render in 1.9s and is visually complete in 8.2s. That’s longer than the 7.4s time to completion in 2017, when Top500 websites were faster.
Mobile websites are also larger this year than last but unlike desktop browsers, mobile sites load. The median mobile home page starts to render in 2s, is visually complete in 7.2s and is 2.1MB. In 2017, the median home page was 1.8MB and was visually complete in 8.2s. Research carried out in conjunction with Knowledge Partners Hitwise and SimilarWeb showed that the median shopper visits seven pages per visit to a Top500 website, spending 4m 45s on it. However, 30.4% of visits bounced. Reasons for this failure to visit a website likely include a page failing to download quickly enough.
Researchers assessed how well websites inform customers and allow them to submit feedback, finding that 62% of Top500 retailers offer product ratings – up 11 percentage points from 51% in 2017 – and 61% offer product reviews, up by seven percentage points from 54% in 2017. Most retailers that show product ratings also show reviews. Testing customer service around returns, 49% of Top500 retailers fully refunded an item and 22% refunded the cost of a return. Retailers give shoppers a median of 28 days to return an item – the same as in 2017 – and took a median of 10 days to process a refund.
About half of Top500 retailers have an iOS app. For the first time, researchers assessed whether apps added to the customer experience by offering live chat – 6% do. Only 2% offer the ability to scan a loyalty card. The customer’s app experience also seems to have improved since last year’s research. In 2017, 29% of Top500 apps had serious bugs but that’s down by 11 percentage points to 18% in 2018.
WHAT LEADING RETAILERS DO
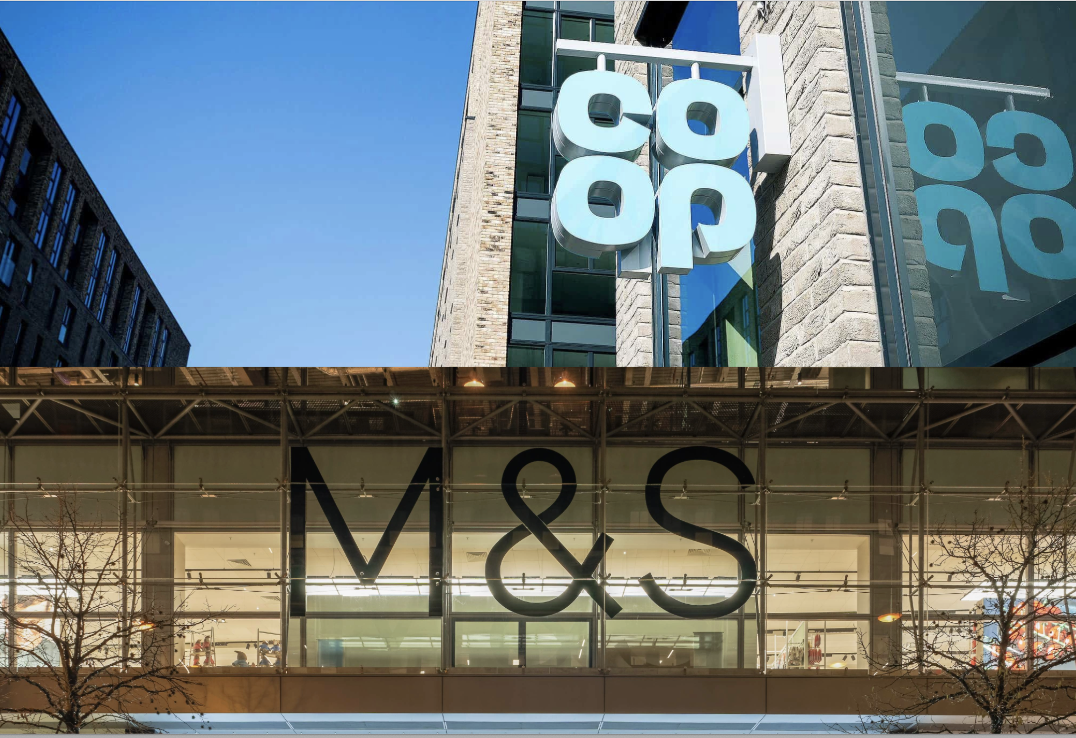
Leading retailers stand for offering services that are relatively uncommon among the Top500, suggesting that they are ahead of the competition in an area. Marks & Spencer stands out for a generous policy that sees both the return and the cost of the return refunded. It also enables written product reviews and scores well on personalisation. Researchers rated Sainsbury’s highly for the quality of its service by email and Facebook. The supermarket supports a high number of channels and customers tend to stay on the website for longer, visiting a relatively high number of pages. It also refunds the cost of returns.
Oasis performs well on website personalisation and for the quality of its service. Tesco is among a minority that enable shoppers to scan their loyalty cards. It has been highly rated for personalisation, and responds quickly to customers’ Facebook queries. Boots’ mobile app combines with top-class customer service to place it among the leaders in this Dimension. It shares reviews on both its desktop website and mobile app. Superdrug performs strongly for customer service and for personalisation. It also refunds both returns as well as the cost of returns.


