We score performance in tests and create an index value. The Aggregated Index Value is the sum of the test results. It gives us a way to compare performance between years, sectors and regions, since a higher AIV represents a greater measured capability and performance. Our benchmarking reveals that performance has markedly improved in most areas over time
Year on year performance of the TOP250 by Dimension
The Aggregated Index Value for each Performance Dimension for 2018 and 2019
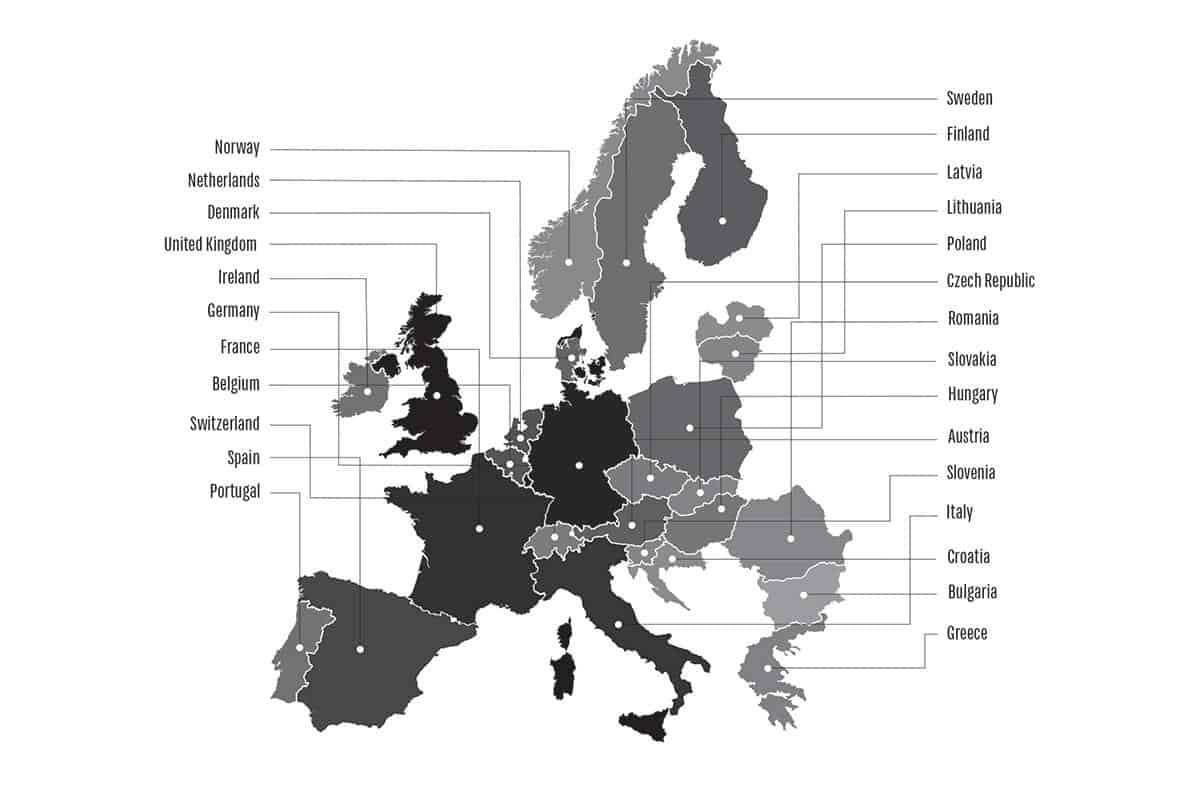
Region performance
The Average Index Value for the following members of the Single Market in 2019 represented as a heatmap from maximum to minimum. Note that localised retail performance is measured for all Top250 brands with operations in the country and the analysis is blind to where the company is based.


