Internet Retailing senior researcher Martin Shaw explains how technology is supporting and improving the customer experience on both desktop and mobile website.
There’s no doubt that technology has improved our experience of online shopping over the years. Where once viewing and buying from an ecommerce website or mobile commerce site was a laborious exercise, today it is a simple and straightforward transaction – and getting easier all the time. In The Customer Performance Dimension report, we have compared the experience of visiting the UK’s leading retail websites, as listed in the IRUK 500.
The idea of measuring the customer experience might at first seem counterintuitive. Surely the way a shopper experiences a website page is highly subjective? Yet data tells us that certain metrics underpin good customer experience: research from the Aberdeen Group (1), first conducted in 2008 and republished this year, found that a one-second delay in page load time has measurable costs. Page views fall by 11%, customer satisfaction is 16% lower, and there’s a 7% loss in conversions.
In our efforts, therefore, to measure the customer experience, we’ve sought to identify some key metrics that underpin a good shopping experience. We start by measuring PageSpeed, as defined by Google. The graph on this page ranks websites operated by the IRUK 500 according to PageSpeed score. The Google score itself contains 30 different metrics illustrating how the site is built, regardless of network speed. They include server configuration, the HTML structure of a page, and its use of resources such as external images, JavaScript and CSS.
Google says that by its own measure, 85/100 represents a well-built site. In this graph we measure how many of the IRUK 500 hit that mark – and find 46% of landing pages succeed.
These findings are encouraging. Web page design has moved quickly, to the extent that we found little difference in PageSpeed score across the different tiers of the leading 500 UK retailers. So pronounced was this effect that there’s little difference between the average page speed score and that of the IRUK 500 Elite retailers. The fact that this score does not conform to how large a retailer is demonstrates a growing and perhaps democratic trend: even a small retailer is able to offer customers an equally usable experience on their website.
Footnotes:
(1) Application Performance Management: The Lifecycle Approach Brings IT and Business Together
We’ve compared the page load times of IRUK 500 landing pages on both mobile and desktop in our efforts to measure the customer experience. From our earlier research, we know that 80% of the IRUK 500 have mobile versions of their websites. In this study, we wanted to contrast the performance of their mobile and desktop sites. Research suggests that desktop sites should load in two seconds: an Akamai/Forrester Consulting study (2) helped set that benchmark for “the new threshold of acceptability for ecommerce web page response times” back in 2009, and it’s a figure still cited today.
Mobile pages, however, can take longer to load, irrespective of the network that they’re on. We used GTmetrix to measure page load times in mobile and desktop browsers. On this occasion, we tested landing pages but in future we’d be interested to test checkout and basket usability.
We found that while most desktop sites loaded (70% fully load within four seconds) there was a wide range when it came to mobile sites, with just under half taking longer than 10 seconds to fully load. Small changes can make a big difference to usability and it was difficult to predict which sites would come out on top. Just two mobile sites loaded in less than a second: those of home and garden retailer Robert Dyas, and of catering supply business Nisbets. It takes a special determination to cut away superfluous content to focus on what’s important on mobile but these two retailers have achieved it. We also found that retailers of children’s goods, from Kiddicare to Lego load quickly on mobile – perhaps these businesses know that when it comes to children, no delay will be brooked.
We found that 11% of the IRUK 500 still don’t have a mobile site that conforms to mobile web standards. Some 89% have the Viewport Meta tag, the standard that instructs on rendering on a mobile-sized screen. That represents progress: when we first tested in March 2015, that figure stood at 80%, but since then the equivalent of 45 ecommerce websites have introduced the tag. What’s changed? It’s likely the fast improvement is down to the ‘mobilegeddon’ unleashed in April when Google started to prioritise mobile-ready sites.
Footnotes:
(2) www.akamai.com/2seconds
(3) IMRG Capgemini Quarterly Benchmarking Report, Q2 2014
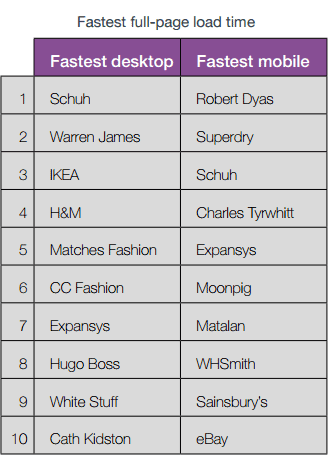
We went on to rank retailers by how fast their mobile and desktop sites load, as shown in the graphs below.
There are no surprises that Schuh, the top-placed Elite retailer in The Customer Performance Dimension, was the fastest to load on desktop and the third fastest on mobile. See the case study on page 22 for more on how this has been achieved. Other strong desktop performers included jeweller Warren James and furniture retailer Ikea, while fashion companies (H&M, Matches Fashion, CC Fashion, Hugo Boss, White Stuff and Cath Kidston) made up six of the top 10.
While Robert Dyas led the way on mobile page speed time, fashion companies Superdry, Charles Tyrwhitt and Matalan were among the top 10 performers in this area. Other notables included Expansys, Moonpig, WH Smiths, Sainsbury’s while eBay brought up the top 10 with a mobile load time of 3.5 seconds.
It’s notable that some relatively small performers such as Moonpig and CC Fashion appear in these top 10 listings: this suggests that size is no bar to performance online. When retailers of any size take the decision to offer good service, they are equally capable of achieving results such as these.
One surprising finding was that we didn’t find the correlation we’d expected between full-page load time and either the bounce rate or the number of pages viewed per visit, as tracked by our knowledge partner SimilarWeb. Before we analysed our figures, we expected to find that the longer it took for the page to load, the more customers would abandon the page. The figures, however don’t bear that out (r=0.06). Moreover, we didn’t find a relationship between pages-per-visit and page load time (r=0.04) What appears to matter is how a page loads. If elements of the page become visible before others, then viewers can start reading text or click on buttons before the final background images come into focus. Perhaps time until the page is interactive is a more meaningful measure, or one that affects the user experience more.
We’ll be carrying page speed data in an ongoing tracker on our website that will update every week. We’ll announce via the InternetRetailing.net newsletter when this is available at www.internetretailing.net/iruk.