Winning new customers and encouraging repeat purchases is at the heart of retail. The Customer Value Chain analyses how retailers and brands go about winning more customers, then retaining them through long-term relationships. This is important since shoppers who spend across sales channels tend to spend more and spend more often.
Profit per customer is the primary key performance indicator (KPI) for this value chain. RetailX research findings in this value chain are grouped here through three questions:
• How do Top500 retailers and brands encourage shoppers to buy?
• How do Top500 retailers and brands grow market share?
• How do Top500 retailers and brands make it easy to check out?
SECTION ONE HOW DO TOP500 RETAILERS AND BRANDS ENCOURAGE SHOPPERS TO BUY?
Retailers increase both the volume and the profitability – or margin – of their sales when they boost contact with shoppers and make it more likely that they will return to buy again. Top500 retailers and brands use a range of tools to achieve this, from filters that help website visitors find the most relevant products to product reviews and star ratings, increasing the likelihood that a potential customer will find the right item for them. Recommendations, covered in this report in the Product Value Chain, also form part of the Customer Value Chain.
FILTER SEARCH BY PRODUCT TYPE
Nine out of 10 retailers and brands enable shoppers to filter searches by product type – up two percentage points (pp) from last year. This helps shoppers find the type of item they are looking for more quickly, which is especially important when a retailer sells a wide variety of products. All Top500 supermarkets and retailers selling flowers and gifts do so, with those selling sports and leisure products (98%), jewellers (83%) and retailers selling hobby supplies (85%) only slightly less likely to do so.
FILTER SEARCH BY PRICE
A growing number of retailers (+4pp to 70%) enable customers to filter search by price. Retailers selling maternity and children’s products (89%), homewares (83%) and marketplace hosts (82%) are most likely to have this feature, contrasting with lower levels of adoption by supermarkets (50%) and flower and gift retailers (51%).
FILTER SEARCH BY BRAND
Around half (52%) of Top500 retailers enable shoppers to narrow down their search by brand. That’s up from 50% last year, with supermarkets (83%), cosmetics (67%), homewares (66%) and multi- sector retailers (66%) most likely to support this. Brand search is less likely to be used on sites selling flowers and gifts (29%) or by brands, although 34% of brands support this.
PRODUCT REVIEWS
Shoppers are more likely to buy when they see what other customers thought of an item, which is why a growing number of retailers now share product reviews. More do so this year (58%) than last year (55%). Reviews seem to be more important for supermarkets (97% show reviews), and retailers selling cosmetics (74%), DIY and trade products (74%) and sports and leisure products (73%). Fashion retailers (48%) and brands (51%) are the less likely to do so, perhaps because judgements about clothing are more subjective.
Slightly more share product ratings than reviews. This year, 59% do so, up from 56% last time. Again, supermarkets (97%) and retailers selling cosmetics (75%) are most likely to share ratings, while fashion retailers (46%) and brands (49%) are least likely.
NUMBER OF PRODUCT IMAGES
The more product images a retailer shows, the more likely it is that customers will see one that interests them, whether they want to see what it looks like on a model or from a variety of different angles. In 2023, 63% of retailers – unchanged on last year – offer a choice of product images. This is led by fashion retailers (76% do so), followed by 72% of sports and leisure retailers and 70% of brands. At the other end of the scale, only 23% of DIY and trade retailers and 30% of supermarkets do this, perhaps because they are generally offering products that meet a need rather than trying to offer inspiration.
The median retailer features a choice of four product images on their mobile website, unchanged on last year. Retailers selling consumer electronics (median of 5.4), marketplace hosts (5.2) and sports and leisure products (5.1) tend to use more images to illustrate products, while supermarkets (1.5) and DIY and trade retailers (2.5) tend to use fewer.
BESTSELLER RIBBON
Some 6% of retailers flag up their most popular products with a ‘bestseller’ ribbon. That’s up from 3% last year. The signage is most likely to be used by cosmetics retailers (18% of sites in the category do so) and by supermarkets (17%). It’s less likely to be used by consumer electronics retailers and brands (less than 1%), and sites selling hobby supplies (2%), homewares (2%) and jewellery (3%).
SECTION TWO HOW DO TOP500 RETAILERS AND BRANDS GROW MARKET SHARE?
The share metric focuses on how retailers increase their share of market spending in their category. It
is assessed in the Customer Value Chain through how convenient retailers make it for shoppers to buy a product, have it delivered and then return it, if necessary.
DELIVERY AND DELIVERY CHARGES
Shoppers tend to prefer free or cheap delivery. RetailX Consumer Observatory research suggests that free delivery is the main reason shoppers sign up for subscriptions since it is cited by 72% of respondents. However, the proportion of Top500 retailers and brands that offer free delivery on all orders has fallen from 20% last year to 18% this year.
More than a third of retailers and brands selling consumer electronics (37%) and jewellery (35%) continue to deliver all orders for free, while less than 1% of those selling maternity and children’s products and flowers and gifts do so. This may be because there’s been a shift to offering free delivery only when shoppers spend a certain amount.
More than half (+1pp to 51%) of retailers now offer free delivery when retailers spend a minimum amount, with retailers selling maternity and children’s products (82%), hobby supplies (73%) and cosmetics (64%) most likely to take this approach. Marketplace hosts (29%) and those selling flowers and gifts (34%) are least likely.
Top500 retailers charge an average of £5.36 (+8pp on last year) for standard delivery – although some may then offer that for free when shoppers spend
a certain amount. The median retailer, meanwhile, charges £4 – unchanged on last year. The median cost is higher when buying homewares (£5.54) and DIY and trade tools and equipment (£5.45) and lower when buying consumer electronics (£2.80) and jewellery (£3.48).
LENGTH OF RETURNS POLICY
Conversely, the longer a retailer gives shoppers to return an unwanted item, the more likely they may
be to buy, even if most don’t then send their orders back. A returns period of 14 days is the legal minimum that retailers must offer. Giving more time to make that return can be a generous offer. Maternity and children’s products give the most time, at an average of 66 days, followed by sports and leisure retailers (60) and fashion retailers (46). At the other end of the scale, supermarkets enable returns of online orders for up to 27 days, while consumer electronics, flower and gift retailers allow up to 28 days from purchase.
Returns policy length is one of a dozen or so indicators we use for the Share KPI within the Customer Value Chain. It’s the sort of thing consumers take into account when purchasing.
Almost all (97%) retailers fully refund products that have not been opened, while 83% of retailers fully refund products that have been opened. Top500 retailers take an average of 12.1 days to process a refund – and the median retailer is close to that at
12 days. Both are unchanged on last year. This year, the fastest median refunds were in the jewellery (9.5 days) and sports and leisure (10 days) categories while the median retailer selling cosmetics, consumer electronics, flowers and gifts, or DIY and trade equipment took 14 days – as did multi-sector retailers.
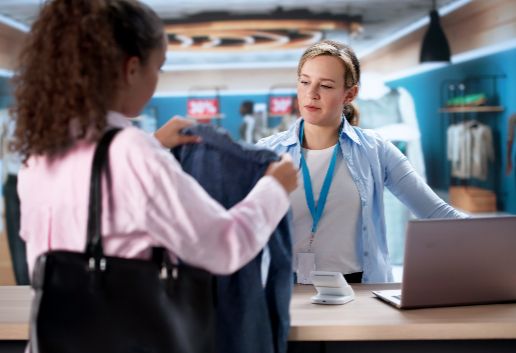
SECTION THREE HOW DO TOP500 RETAILERS AND BRANDS MAKE IT EASY TO CHECK OUT?
Removing friction from the checkout has long been a goal for retailers aiming to cut down on the number of people abandoning purchases. Retailers do this by offering guest and third-party checkout options. However, requiring shoppers to register to checkout does have its own benefits, as retailers can start to build relationships for the longer term when they acquire more information about their customers. In this area, retailers have a balance to find.
REGISTRATION BEFORE CHECKOUT
Almost two-thirds (64%) of retailers now require shoppers to register before they checkout. That’s up from 62% last year. Retailers selling maternity and children’s products (80%) and cosmetics (77%) are most likely to do this, while supermarkets (27%) and marketplace hosts (44%) are less likely to do so.
FACEBOOK CHECKOUT
Some 11% of 484 retailers and brands assessed on this metric both this year and last use Facebook Checkout. That’s up from 10% last year. Marketplace hosts (35%) are the most likely to offer this as an option, followed by those selling cosmetics (25%) and multi-sector retailers (20%). Few DIY and trade equipment retailers (less than 1%) offer this option.
PAYPAL CHECKOUT
More than a quarter (28%) now enable shoppers to use PayPal to checkout. That’s up from 27% last year. Retailers selling sports and leisure products (39%, maternity and childrenswear (38%) and hobby supplies (35%) are most likely to have this payment method – while supermarkets (12%) are least likely.
The Customer Value Chain analysis comes from the 2023 RetailX UK Top500 report. Download it here to see the graphics and list of leading retailers and brands in this value chain, as well as this year’s full Top500 listing.