Shoppers expect consistent levels of service across channels. RetailX research reveals how well retail brands are doing here
In the Customer Performance Dimension, RetailX researchers assess the customer experience and service that retail brands offer. That starts with customers’ experience on the brand’s commerce website.
It continues when they download its mobile apps, and contact the brand through customer service channels, and ends with a look at the experience customers can expect should they decide to return an item. RetailX researchers take the customer’s viewpoint in determining how easy brands make it for shoppers to achieve their aims on their websites. That’s because the question of whether it’s simple and straightforward to buy has a direct impact on whether a shopper will return again.
RetailX researchers assessed the customer service promises that retailer brands make, and the service that shoppers experience, through more than 40 metrics that taken together give a multi-layered picture of how retailers respond to their customers’ needs.
Those metrics include how much choice retailers give to customers in the way that they contact the brand, and how quickly websites – both mobile and desktop – load. Customer service is measured through an assessment of both how fast and how effectively traders respond to shoppers’ queries, and continues by considering how well retailers inform customers about the products they sell, and how easily they enable customers to find them through search and navigation tools. The metrics end with the return experience: considering the way that returns are handled to be an important final aspect of customer service, assessed the full promise in this area as well. Below we look at the areas where the most significant changes were found in 2019, compared to 2018.
What the RXBX Top250 do
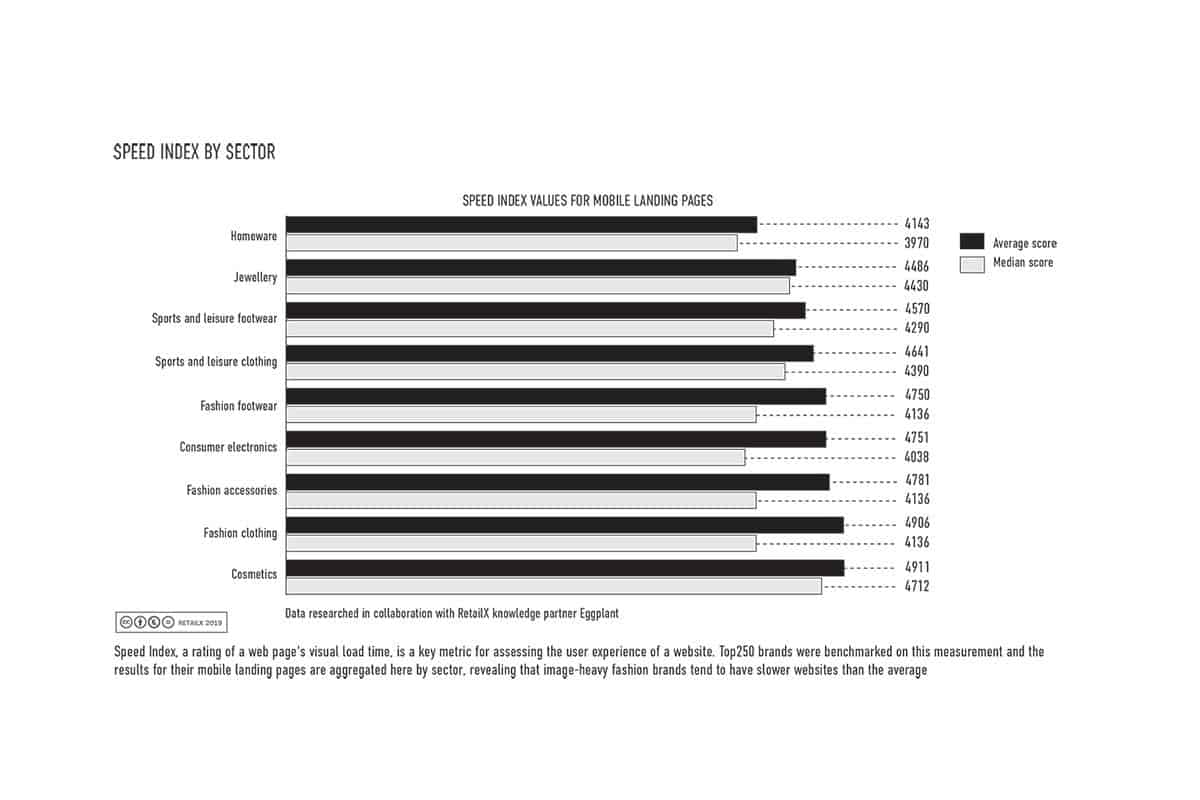
RetailX researchers judge that the customer experience starts with how quickly consumers can view a mobile or desktop website. Research carried out in collaboration with InternetRetailing Knowledge Partner Eggplant found that desktop websites, as measured through the Speed Index, took longer to load in 2019.
That may be because they featured larger landing pages than in previous years. Landing pages were an average of 4.1MB and a median of 3.2MB – 0.3MB larger than a year earlier. The average desktop website took longer to load in every member state than it did a year earlier. Those localised to Sweden and Poland loaded in the shortest times, but were still slower than a year earlier. Those localised to Hungary, Greece and Romania took the longest to load, and were also slower than a year earlier.
The story was similar on mobile, where landing pages were smaller than those on desktop websites, at an average of 3.8MB. That’s 0.3MB larger than a year earlier. The smallest landing pages were found in the homewares (2.7MB) and consumer electronics (2.8MB) sectors, while the largest were in fashion footwear (4.7MB) and accessories (4.5MB). Websites localised to Greece and Poland saw the biggest improvement in speed since last year, but those localised to the UK, Portugal and the Czech Republic were slowing down to the greatest extent.
Brands enabled shoppers to get in touch via 7.8 communications channels in 2019, most commonly including a variety of social media channels, live chat, phone, email and web submission form. But of those brands that had an iOS mobile app, only 4% offered shoppers the option of getting in touch via live chat in the app.
Researchers also reviewed how easily and how quickly they could navigate Top250 websites. They found that, on desktop, websites selling sports and leisure goods were, on average, the most easy to navigate, while those selling consumer electronics and homewares were the least navigable. Mobile websites in the fashion clothing and jewellery sectors were the easiest to navigate from smartphones, while those selling consumer electronics and homewares were the least easy to get around.
Brands appeared to be becoming less flexible on returns. The median length of a returns policy fell by two days to 26 days in the latest research, compared with the previous year. The shortest was in the consumer electronics sector, where shoppers had an average of only 17 days to return unwanted items. That’s not far off the 14-day minimum returns period guaranteed by EU legislation. The longest average, however, stood at 30 days for buyers of sports and leisure clothing, footwear and equipment.


