Talking to customers
Leading retailers give shoppers more choice in how they get in touch and ask questions
Retailers that enable conversations that both inspire shoppers and answer their questions stand out in the Brand Engagement Dimension.
At the forefront are traders that engage with existing and potential customers across a variety of channels. This matters because it’s by enabling shoppers to learn more about products and services that traders can foster trust both in what they are selling, and how they deliver on their promises.
In this Dimension, RetailX researchers focused on the communication channels – from social media to email and phone – that retailers provide for shoppers, and on how they help customers learn from what others thought, or share their own thoughts with others.
They evaluated retailers’ reach and interaction on Twitter through metrics including how many followers, retweets, and favourites they had, as well as how often they updated their status.
Researchers also looked at whether Top500 retailers required shoppers to register before checking out, something that helps retailers to improve their single view of the customer but may deter shoppers from buying, and certainly adds an extra point of friction that can slow down the final transaction.
They also considered how many website visits Top500 retailers received during the course of a year, as well as the bounce rate using data from InternetRetailing Knowledge Partner SimilarWeb. Researchers deemed both to be key measures of shopper interest in the brand.
What Top500 retailers do
The 2019 analysis of Top500 retailers found that traders enabled shoppers to get in touch with them via an average of 9.5 and a median of 10 communication channels.
That’s up from a median of eight in 2018, and suggests that most retailers added more options during the course of the last year. Those selling homewares, drink, fashion footwear, clothing, children’s toys, cosmetics and health products communicated through a median of 11 channels, while those selling utilities and automotive goods used a median of eight.
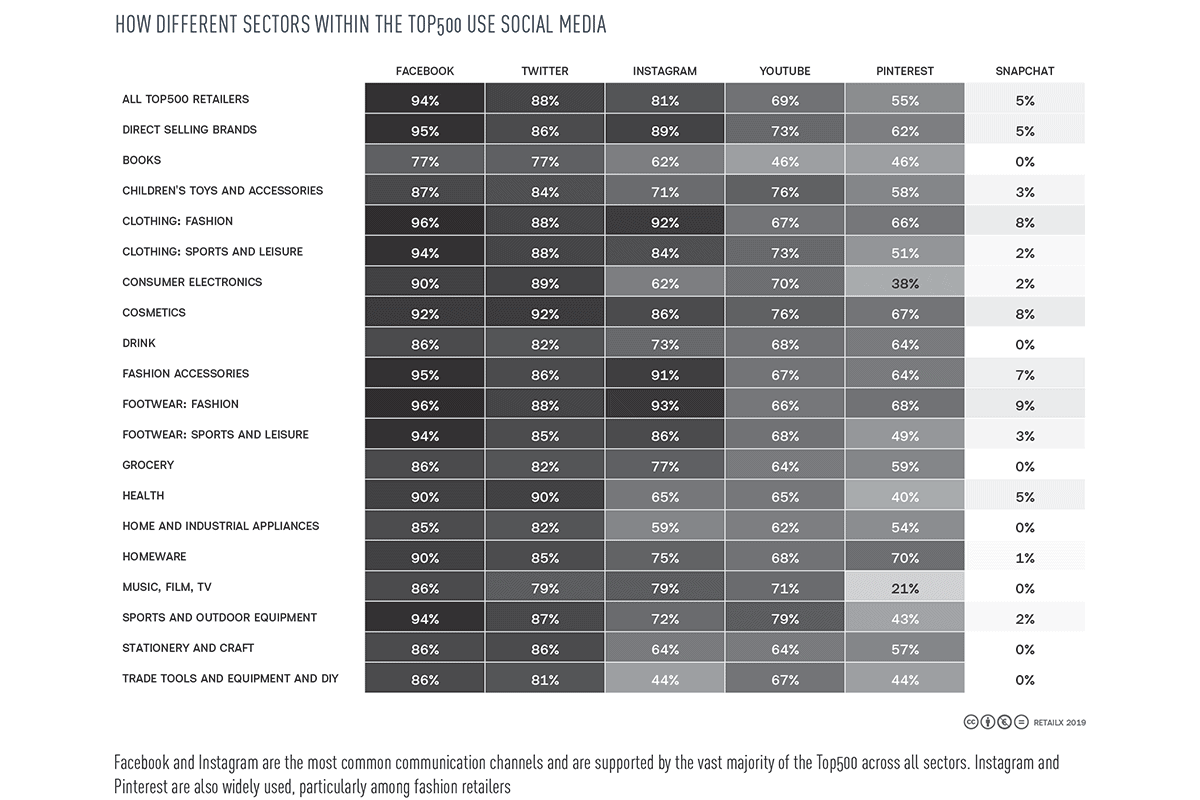
Most stayed in touch with existing and potential customers through a Facebook page (94%) and a Twitter account (88%). On Twitter, Top500 retailers had an average of 219,000 followers: larger retailers have much larger followings, however, since the median number was just over 30,000.
But there’s also strong interest in using other social media channels as well. Among the Top500 of 2019, 81% had an Instagram profile, while 66% were on YouTube, 55% on Pinterest and 5% on Snapchat.
What other people thought about a product makes a difference to shoppers as they decide whether to buy, and most Top500 retailers showed product reviews (57%) and ratings (54%) on product pages. Retailers selling sports and outdoor equipment were the most likely to share product ratings (83%) and reviews (81%). These features were least commonly deployed among those selling ready-made food, where 40% shared reviews and 38% ratings.
Fewer enabled customers to share their opinions via social media than used product reviews and ratings. Almost a third (30%) of 2019 Top500 retailers enabled users to share a product with friends on social media, while 8% enabled them to ‘like’ a product on social media through a link on the product page.
That’s changed since last year when 53% of retailers included in the Top500 in both 2018 and 2019 Top500 enabled sharing via social media, and 18% enabled social media likes. In 2019, more than half (54%) of retailers showed obvious promotions on their website.
How easy do Top500 retailers make it for shoppers to buy? Almost half (46%) required registration before purchase in 2019.
The average Top500 retailer enjoyed 8.1m website visits a year – although the median figure was closer to 2.4m, which demonstrates the disparity between ecommerce giants and the other retailers to feature in the Top500.
Software retailers had an average of 66.8m website visits a year, and a median of 26.9m, followed by those selling music, film and TV (41.9m average, 18.2m median). At the other end of the scale, retail websites selling sports footwear saw an average of 9.3m visits a year, and a median of 2.8m.
What leading retailers do
Boots enabled shoppers to easily engage with it via its mobile app, where it offered the ability to see, and share, product reviews, ratings and ability to share products on social media.
Sainsbury’s appeared to foster good relationships with loyal customers, as measured through its friends count on Twitter and the number of times shoppers visited its website in a year. It also enabled customers to share their opinions, through product ratings and through sharing products with friends.
Argos was highly rated for the use of personalisation. In addition, it shared product reviews and ratings, and had live chat on its app.
Amazon shared a range of information about products via its mobile app, which hosted product videos, live chat, written product reviews and daily deals.
Marks & Spencer scored highly by enabling customers to review and rate their products via their mobile app, as well as allowing users to share products to their social media accounts.
Wickes shared product ratings and reviews and made promotions clear. It also allowed customers to complete their transaction without registering.
New Look shared daily deals on its mobile app, and product ratings on its site. It stood out as an active Twitter user. It did not require registration before checkout.
Dunelm shared product ratings and reviews on its website and supported a relatively high number of communication channels. It flagged up deals through clear use of promotions on its site.
Next helped shoppers find the best prices by sharing daily deals and flagging up promotions on its website. It showed what other customers thought through the use of product ratings, and supported an above average number of communication channels.