RetailX researchers took an analytical approach to find out how leading UK retailers use Facebook in practice. Fernando Santos, RetailX project manager, explains how they did it, and what they found.
Facebook is now a fact of life for most leading UK retailers. IRUK Top500 research shows that with 94% of retailers using Facebook, the social media platform is both the single channel that retailers are most likely to use, and the most widely used in the industry.
But does the way they use it vary between brands, or is there a common approach that most retailers take to the channel? We’ve gone back to a study that we first carried out in 2018 which analysed the Facebook content of the Top50 retailers.
In 2019, we looked at the most recent post published on the social media feed of the Top100 retailers and analysed the different elements that it included, from the type of content to the messages that the content aimed to share. We also looked at what time retailers published the posts. By doing so, we believe we’ve built a snapshot of social media in practice.
Considering content
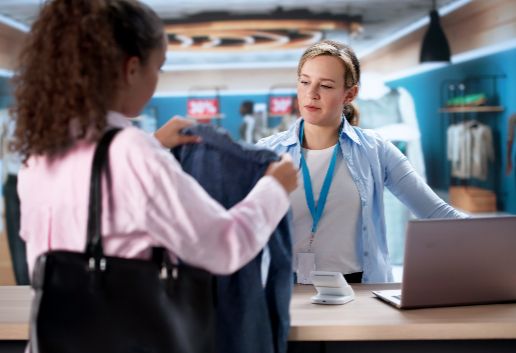
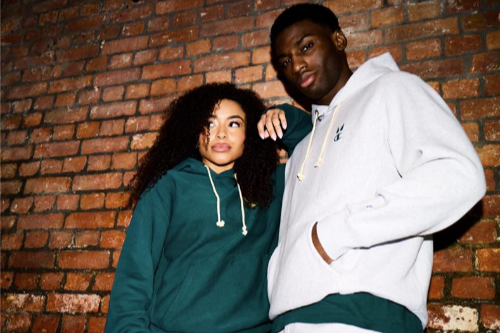
This group of leading UK retailers stands out for its use of images on Facebook. Eight in 10 (81%) of the posts analysed featured a picture. Those images were not used in isolation – 73% of the posts that we analysed were immediately preceded by a post that used the same approach. Overall, most retailers used two pictures in a row.
Video was used in 12% of posts, while 6% featured a gif. Only 1% were text-only, suggesting that most retailers do choose to illustrate their messages, likely judging that this will make them more engaging.
Measuring intention
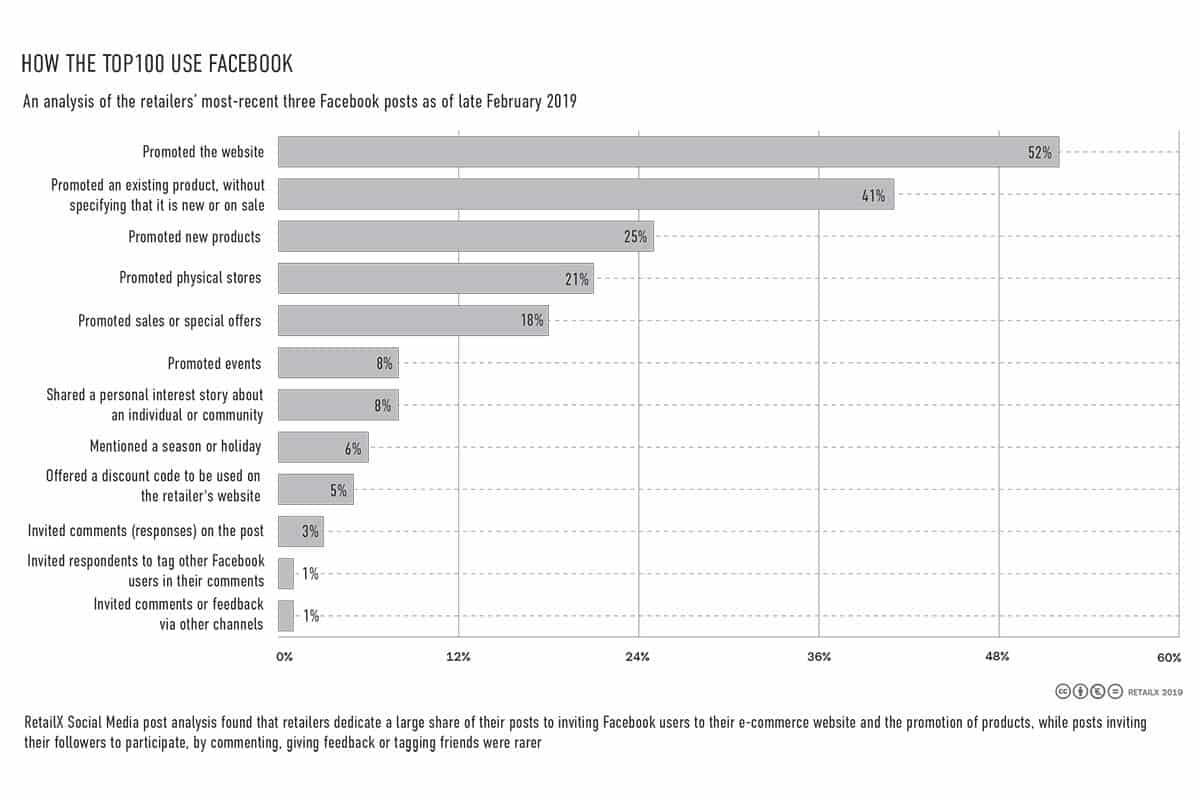
The largest group of posts – accounting for just over half (52%) of all those analysed – was designed to promote or encourage visits to the ecommerce website that each retailer operated.
Four in 10 (41%) were designed to promote an existing product, while 25% specifically promoted new products. One in five (21%), meanwhile, directed shoppers towards physical stores, while 18% of posts were designed to promote either a sale or a discounted special offer. Discount codes that could be used on the retailer’s website were shared on 5% of posts.
A small minority of posts were in categories that we’d class as being more engaging. Only 8%, for example, promoted an event other than a sale, while 6% mentioned the season or a holiday. The same proportion focused on a personal interest story about an individual or a community. Meanwhile, few Facebook posts gave the impression of starting a conversation. Just 3% of posts invited readers to send a direct message or post a comment, while 1% invited them to tag friends in order to include them in the conversation. The same proportion invited shoppers to add comments or feedback via another channel, asking, for example, readers to email the retailer on a Facebook post.
Focus on frequency
The median Top100 retailer added one post to their Facebook page every day, at a median time of 12.30pm, UK time. The largest group of posts was published in the morning – 46% of the Top100 posts were added before 12 noon. Just over a third (33%) were added between noon and 8pm, while the remaining 19% were added in the evening.
Direction of travel
How have things changed since last year? We can’t draw direct comparisons, since last year’s research focused on the Top50 rather than the Top100. But putting our findings from the two years side by side may help build a picture how retailers use social media to engage with their existing and potential customers.
With these caveats in mind, it’s interesting to note that a larger proportion of Top100 retailers offered discounts in their 2019 posts (18%) than were found among the Top50 in 2018 (12%). They were more likely to promote new products on a post in 2019 (25%) than in 2018 (10%).
In 2018, 34% of posts provided information about a product, while 41% did so in 2019. Events were flagged up by 8% of posts in both years, but fewer encouraged readers to comment in 2019 (3%) than in 2018 (20%).
That may be down to the luck of the draw, but it may also suggest that across the Top100, retailers are now less likely to devote their resources to answering social media messages.