Shoppers are well served when retailers provide an experience that meets their needs, whether they’re browsing, buying or asking a question, writes Martin Shaw of InternetRetailing’s RetailX research team.
British shoppers are seeing a steady improvement in the service that they receive from retailers across digital sales and communication channels. Leading retailers in The IRUK Top500 Customer Performance Dimension offer shoppers a wide choice of channels that they can use to get in touch with a question or problem.
They answer those questions quickly. They then also impress with how relevant they make their website to browsers, whether that’s through strong navigation or personalised service. This is important because the evidence suggests that retailers that make their websites relevant to shoppers are more likely to see their conversion rates, sales performance and, in due course, also their profits rise.
Performance among the Top500 as a group is developing steadily too. Under the twin pressures of customer demand and competitor improvements, UK retailers across the industry are steadily developing their own performance.
In doing so, they’re likely to be responding to how their particular group of customers wants to be served, doubling down on the investments that they make that increase conversion and moving away from those that reap few returns.
Fine-tuning performance in the light of customer demand, and through the use of a testing programme, can be demanding in the short-term, but it’s something that should pay off long-term.
How we approached this dimension
In our research we’ve worked to measure the quality and breadth of experience that customers receive, whether they buy via their mobile phone or from their desktop, and whether they choose to communicate with retailers over the telephone, social media or email. It’s by giving the customer the best online experience that retailers stand out for their performance in this Dimension.
As in previous years, we’ve measured how many channels shoppers can use to get in touch with each Top500 retailer, and we’ve evaluated the service they offer in response to email and Facebook messages.
We contacted each and noted both how quickly the response arrived, and how relevant that response was to our original question. We looked at how quickly desktop and mobile websites launch, measuring a number of metrics, such as how quickly the home page starts to load, to how quickly it reaches the point at which it is visually complete.
These, we believe, are important measurements in light of the insight that shoppers tend to move away from websites that don’t launch quickly. Google research, The Need for Mobile Speed, published in 2016, found that 53% of mobile users abandoned websites if they didn’t launch within three seconds.
That’s a statistic likely to have grown in the intervening time, so we believe it’s an important measure of the customer experience. Crucially, when website visitors abandon a website, they’re likely to have found the experience a frustrating one, so will be far less likely to return in the future.
We’ve also measured how easily shoppers can navigate a desktop website and whether both websites and mobile apps feature product reviews and ratings. These are important as they enable customers to share their own feedback and to take what other people thought into account when deciding whether to buy.
We also include in this Dimension a focus on returns, since this gives an insight into customer service after the purchase. We look at whether retailers fully refund an item that is returned, and whether they also underwrite the cost of making that return through postage or pre-paid envelopes. We look at how long the returns process takes, as well as how long after delivery customers are able to return items.
The customer experience is, inevitably, changing as the ecommerce and multichannel retail markets mature. We’ve responded to that fast change by expanding our research to include new metrics in 2018 that better reflect the efforts of an industry that is constantly evolving.
Measures that are new this year include the average time shoppers spend on a website, as calculated in partnership with InternetRetailing Knowledge Partners Hitwise and SimilarWeb. We believe this metric reflects how engaged shoppers and browsers are with a website. It’s also likely to illuminate whether they find it easy to use and whether it meets their needs.
That last point is also reflected in our focus on personalisation and relevance, both important factors in this Dimension this year. We look in particular at the relevance of search results on a desktop and a mobile website, the use of personalisation on the website, and a number of mobile-specific user experience (UX) metrics that are assessed for the first time.
We assess ease of navigation, the relevance of search results, and note the use of a ‘hamburger’ button – the three lines that are standard in modern mobile navigation – on mobile websites for this year’s ranking. Around half of Top500 retailers have one or more mobile apps, and the user experience on their main app forms part of this assessment. It’s important to note that retailers without an app are not marked down in this research.
However, retailers that do have them will be judged on the user experience they offer through this channel. Metrics here include whether live chat (one of the most popular customer service channels) is available on the app, along with different features that retailers can use to personalise their experience.
Whether app users can scan in a store loyalty card has a particular significance because it suggests that retailers may be using loyalty on the app to complete a single view of the customer across sales channels. It’s on this single view of the customer that more personalised and, in turn, relevant service can be built.
What the Top500 do
Top500 retailers enable shoppers to communicate with them via a median of eight channels. Almost all (98%) use both Facebook and Twitter. That’s followed by the phone (96%) and email (95%). Least widely used of the 13 channels assessed are live chat (37%), Snapchat (22%) and Tumblr (17%).
We found that desktop home pages are bigger in 2018 than they were in 2017, and take longer to become visually complete, but that mobile pages are getting faster to load, even though they are slightly larger than they were last year.
Researchers found that among the Top500, desktop home pages come in at a median 2.6MB, up from 2.3MB in 2017. In tests, they started to render in a median of 1.9s and were visually complete in 8.2s. That’s up from 7.4s in 2017. Mobile home pages started to render in 2s and were visually complete in 7.2s, after a page of a median 2.1MB was downloaded. In 2017, a median 1.8MB page was visually complete in a median of 8.2s.
Research carried out in conjunction with Knowledge Partners Hitwise and SimilarWeb showed that shoppers visit a median of seven pages per visit to Top500 websites, spending a median of 4m 45s on it. However, 30.4% of visits bounced. It seems likely that this bounce rate is due to pages failing to download quickly enough.
Researchers assessed how far websites gave shoppers insights into what others thought about the products they were considering buying. They found that 62% of Top500 retailers offer product ratings – up 11 percentage points from 51% in 2017, and 61% offer product reviews, up by seven percentage points from 54% in 2017.
Almost all retailers that show product ratings also share reviews. This fast growth suggests that businesses are answering customer demand for information and informed opinions. Perhaps they have found that investment in reviews and ratings earns a return through boosting conversion.
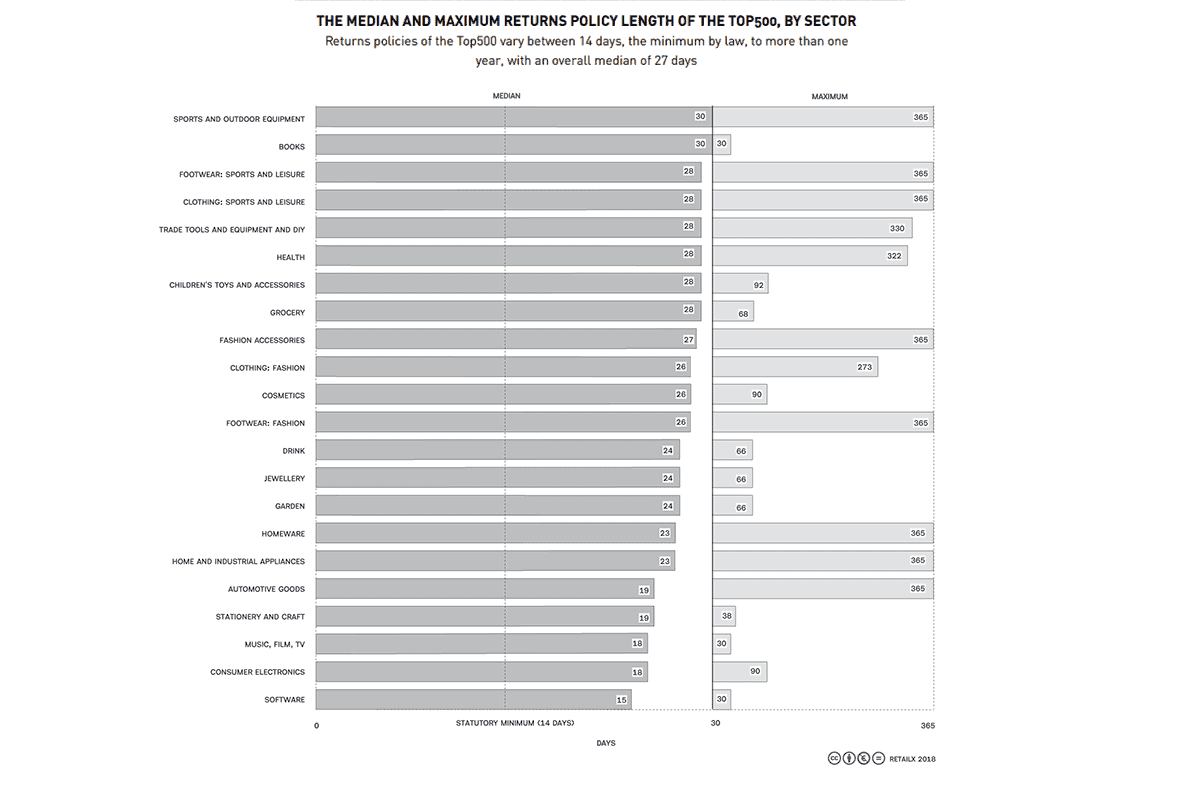
When we looked at customer service around returns, we found that almost half (49%) of Top500 retailers fully refund an item, and 22% refund the cost of a return. Retailers give shoppers a median of 28 days to return an item – staying the same as in 2017 – and take a median of 10 days to process it.
About half (265) of Top500 retailers have an iOS app. For the first time, researchers assessed whether apps add to the customer experience by offering live chat – 6% do. The feature was measured for the first time in 2018 and will be monitored over time to see if uptake increases.
In total, 6% of multichannel retailers enable shoppers to enter the details of an existing store loyalty card (down from 9% the previous year), but only 2% offer the ability to scan a loyalty card – a figure measured for the first time in 2018. Meanwhile, the 2% of retailers with mobile apps that enable shoppers to set up a loyalty account on the app halved from 4% in 2017.
The decline in retailers enabling shoppers to manage and activate loyalty accounts through their retail app may reflect a lack of consumer interest in the function. However, those retailers that do enable such functionality stand to benefit as shoppers use their loyalty card across all channels, completing retailers’ views of their behaviour.
There were also small declines in the number enabling shoppers to leave reviews (26% from 27%) and ratings (26% from 28%) via the app. The quality of apps also seemed to have improved since last year’s research: in 2017, 29% of Top500 apps had bugs – down by 11 percentage points to 18% in 2018.
What leading retailers do
Leading retailers sand out when they offer services that are relatively uncommon among the Top500, suggesting that they are ahead of the competition in this area.
Commonly, they stand out when they offer product reviews, whether on desktop or in their mobile apps, and score well for personalisation.
This suggests that these are emerging technologies that many do not offer. Being ahead of the curve makes them well-placed to respond to customer demand, and to set the bar for those customers’ expectations. Standing still, however, will not be enough for retailers to maintain their position in the future.
In our research, we found that high street favourite, the food-to-homewares retailer Marks & Spencer, stands out for a generous policy that sees both the return and the cost of the return refunded. It also offers written product reviews and scores well on personalisation.
Health and beauty specialist Superdrug performs strongly for customer service and for personalisation. When shoppers return an item, the retailer refunds not only the return but the postage cost of making that return.
Customer service is highly rated at both fashion-to-homewares retailer Laura Ashley and supermarket Morrisons, which also scores high on the ease of navigation. Laura Ashley supports a wide number of channels that shoppers could use to get in touch, giving its customers the opportunity to use their preferred communication method.
Boots’ mobile app combines with top-class customer service to place it among the leaders in this Dimension. It shares product reviews on both its desktop website and mobile app.